Tyler Nigon
3 May 2018
Advisors: Ce Yang & David Mulla
Background
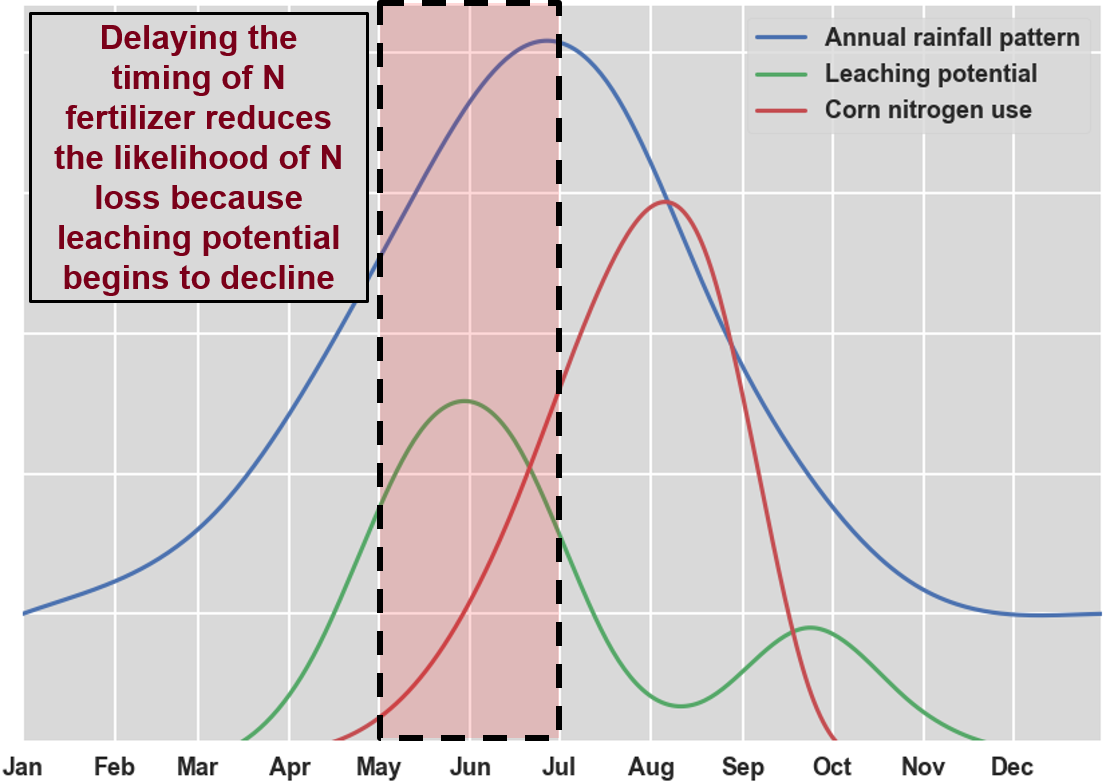
Due to soil spatial variability and the unpredictable role that weather plays on soil and crop nitrogen dynamics, uncertainty in predicting optimal fertilizer nitrogen (N) rates for corn is high, and consequently, final recommendations for individual fields are less accurate than desired. Much attention is given to balancing the economic, environmental, and social pressures that influence N rate recommendations. However, little is understood about how accurate N recommendations can be determined to properly quantify these pressures in the context of optimum N fertilizer rates, especially while accounting for spatial variability (both within and across fields). A strategy used by producers to reduce the likelihood of N loss is to delay the N fertilizer application by applying at least part of the crop’s N requirement after emergence. With this strategy, the opportunity exists to apply as a variable rate application. The economic optimum N rate in corn typically varies spatially, so better matching fertilizer rate with crop requirement reduces the likelihood of N loss to the environment (Figure 1).
Both remote sensing and crop systems modeling have been implemented commercially for adaptive N management (e.g., Crop Circle, GreenSeeker, Adapt-N). Each of these techniques has advantages and disadvantages when used as a tool for developing in-season N recommendations, but overall, both techniques have struggled to gain traction for use in a commercial setting because they each have practical limitations that have not yet been overcome:
Model approach:
Pros:
- Assess expected additions and losses that are not yet reflected by the plant (e.g., due to management, weather, etc.)
- Provides estimate of yield potential, which is important in the final recommendation
Cons:
- Does not inherently account for spatial variability
- Accuracy relies on calibration from observed data
Remote sensing:
Pros:
- Real-time assessment of the crop N status
- Accounts for in-field variability at high spatial resolution
Cons:
- Delayed sensitivity of symptoms
- Dependency on stress thresholds
- Lack of specificity to N stress in absolute units
Project goal
The overall goal of this work is to leverage the advantages of both remote sensing and crop modeling to develop improved in-season N recommendations. To implement this, we are using remote sensing collected during the early growth stages to estimate crop growth (e.g., above ground biomass) and be used to calibrate the EPIC model prior to the sidedress N fertilizer application. This approach allows for multiple calibration opportunities during the season while accounting for spatial variability. It is hypothesized that this integrated approach will be able to predict the economic optimum N rate more accurately than either the remote sensing or modeling approach when used alone.
Methods and preliminary results
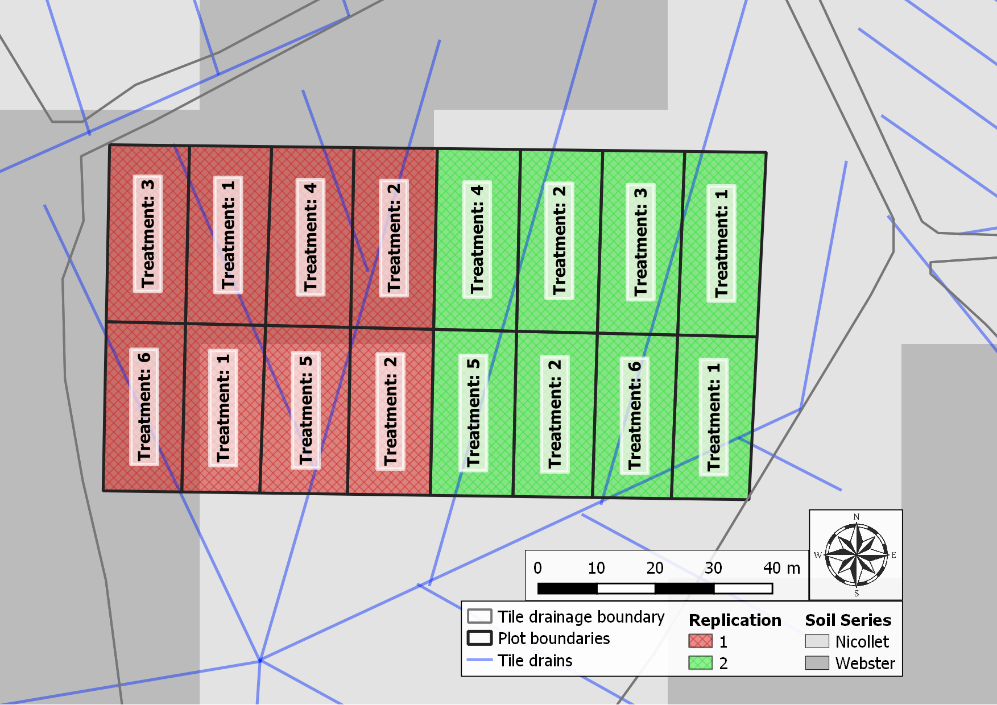
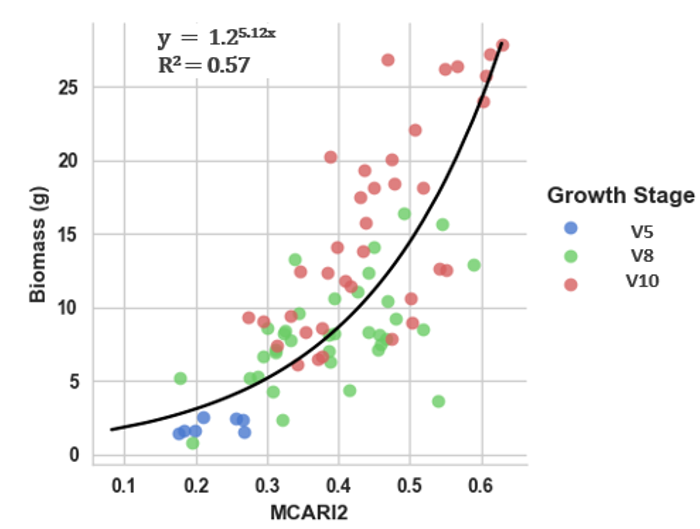
A field study was conducted at the Agricultural Ecology Research Farm at the Southern Research and Outreach Center near Waseca, MN in both 2016 and 2017 (Figure 2). The study area was comprised of 16 individual treatment plots (30 m x 14 m). Four N fertilizer rates (0, 67, 135, and 202 kg N ha-1) were applied at either preplant or the V5 growth stage for a total of 6 treatments (Table 1). Aerial imagery was collected at the V5, V8, and V10 growth stages and the Improved Modified Chlorophyll Absorption Ratio Index (MCARI2; Equation 1) was applied and used to predict above ground biomass.
An exponential curve best modeled the relationships between MCARI2 and (Figure 3). Using the exponential model from Figure 3, biomass will be estimated for each area of the study area and will subsequently be used to calibrate the model. EPIC (Environmental Policy Integrated Climate) is the model being used in this project. EPIC simulates soil and crop-related processes for a specific site, and operates on a daily time step. EPIC calibration and validation results for this study are expected soon.


