Aicam Laacouri
5 April 2018
Advisor: David Mulla
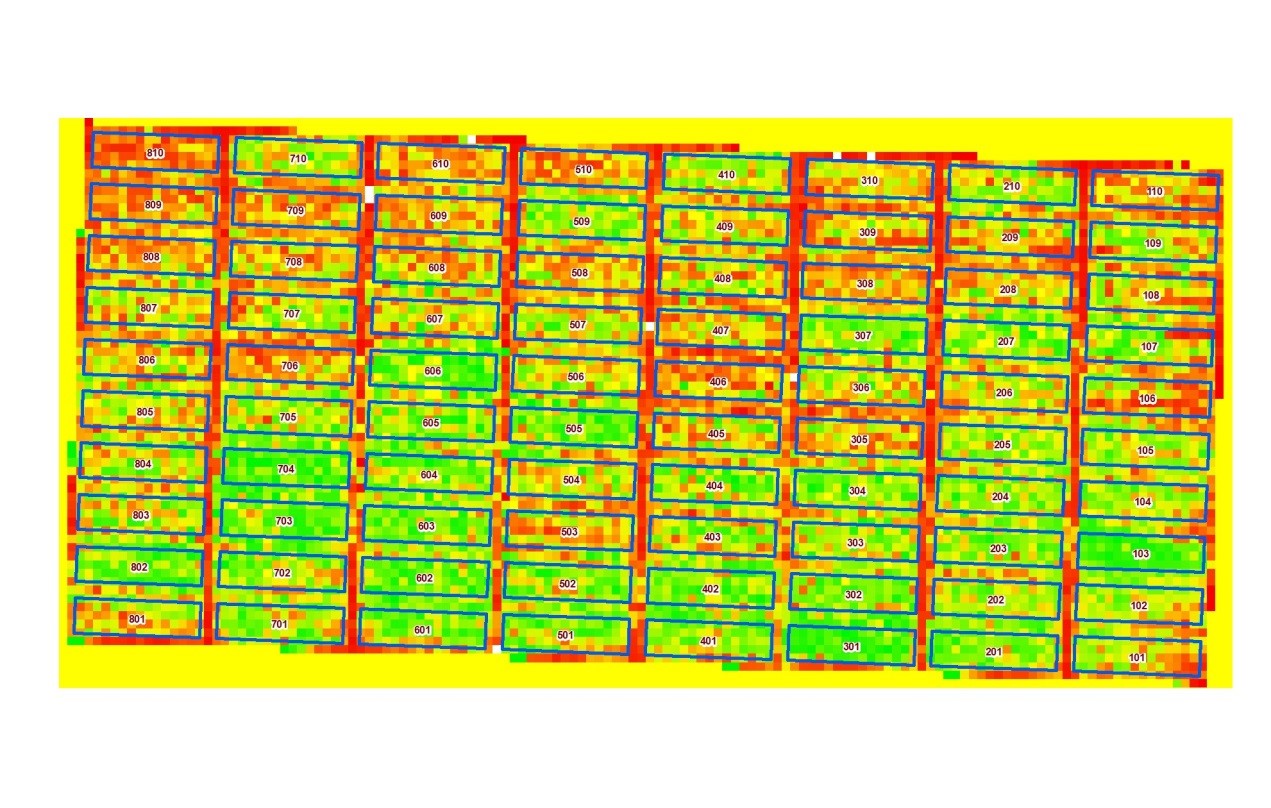
Corn was grown in four fields in southern and southeastern Minnesota using a randomized complete block design. An octocopter equipped with a Tetracam Mini-Multiple Camera Array system was used to capture aerial imagery at three corn growth stages (V6, V10 and R2). Vegetation indices (VI) computed from UAV/multispectral imagery were compared to chlorophyll readings, ground-based optical measurements and indices derived from National Agriculture Imagery Program (NAIP) aerial images.
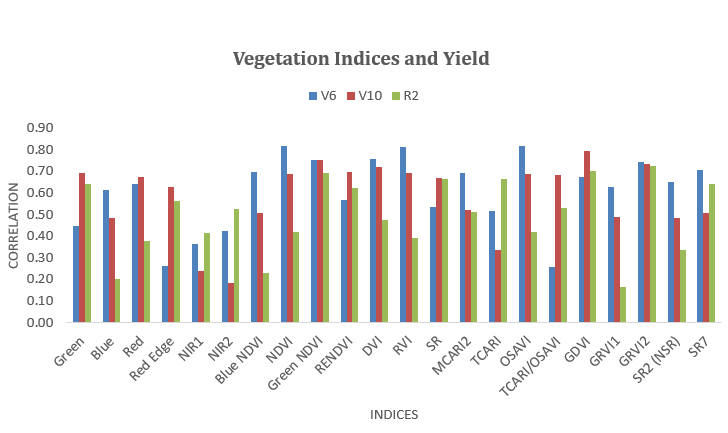
UAV–derived indices coupled with estimates of economic optimum nitrogen rates (EONRs) were used to quantify in-season corn nitrogen stress and to compare sidedress efficacy of site specific and field based nitrogen recommendations. UAV-derived block-normalized green ratio vegetation index (GRVI) and green normalized difference vegetation index (GNDVI) were strongly correlated with SPAD, Crop Circle and NAIP indices in estimating corn nitrogen status. The performance of VI at quantifying nitrogen status in corn is growth stage specific. Nitrogen sidedress based on block-scale V10 GRVI had 80% efficacy when compared to pre-plant EONR yield. This site-specific technique outperformed field-scale algorithm (55% efficacy).
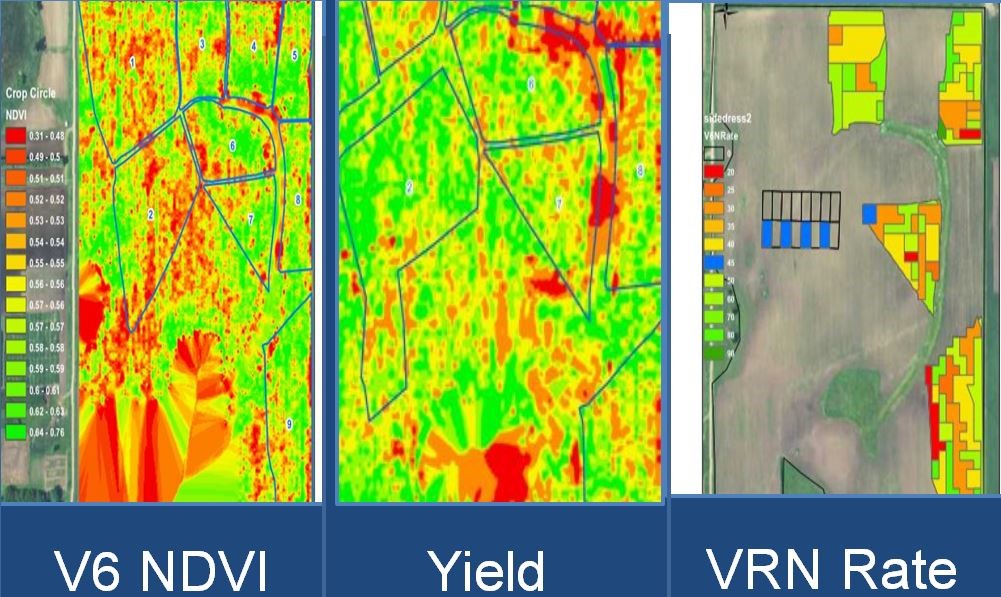
In the second project, field-scale variable rate nitrogen (VRN) application was compared to conventional uniform pre-plant application. Preliminary results show a water quality benefit for VRN reducing nitrate leaching. On average VRN fields required 30% less nitrogen fertilizer compared to the EONR without impacting yield.


