Muhammad Tahir
3 May 2018
Collaborator: David Mulla
Introduction
Nutrient losses from Corn Belt states have been linked to hypoxia in the Gulf of Mexico. High nutrient losses from the Upper Midwest are partly due to high fertilizer application rates on corn, and mineralization of soil organic matter, precipitation and irrigation patterns that cause leaching and drainage. Goals to reduce nitrate-N loads include a 45% reduction for the Gulf of Mexico, Minnesota interim target is 20% by 2025. Ground water is increasingly at risk for nitrate contamination in Minnesota. Most vulnerable areas are the Central sand, Karst and tile drained regions of southern MN. Extensive monitoring of nitrate-N in nearly 900 wells by MDA and MPCA showed that 40% of groundwater wells in sand and gravel aquifers located in central Minnesota exceeding 10 mg/L, while 10% of wells in southeastern Minnesota exceeded the drinking water standard (Kroenig and Ferry, 2013). Optimizing N rates for agronomic and environmental considerations continues to receive much attention. However, selecting optimal N fertilizer rates is surprisingly difficult, due to quantity of potentially mineralizable N (Fernandez et al., 2017), soil types, precipitation pattern and other climatic factors.
Agro-hydrological simulation models can be useful tools for estimation of crop yield, nutrient uptake, and their leaching in soil, and can settle the nutrient management related issues over several seasons. Though, computer models can be of great value in evaluating the effectiveness of practices to predict yield and NO3-N to ground water, models are most accurate when calibrated and validated using site specific experimental data. Environmental Policy Integrated Climate (EPIC) model is a continuous time, field scale agricultural management and water quality model. EPIC functions on a daily time step. It can simulates >80 crops with using unique parameter values for each crop, still new crops can be added. EPIC has >200 input parameters, however few more sensitive can be optimized according to the climatic conditions, and management practices. Having wide range of input parameter, it can be configured for a wide range and variety of management practices. EPIC has capability to simulate management components including crop rotations, tillage, irrigation scheduling, drainage, furrow diking, liming, grazing, tree pruning, thinning, manure, and nutrient application rates and timing. EPIC can also do prediction under alternative scenario, such as auto-trigger at specific matric potential for irrigation scheduling, and at specific N contents in plant biomass to apply fertilizer.
We are focusing on the following BMPs: a) Fertilizer N practices (rate, timing, splits etc.) and forms of N (urea, slow release, etc.); b Water management practices (checkbook method, and other irrigation scheduling methods); and c) Vegetative management practices (cover crops, cropping systems etc.).
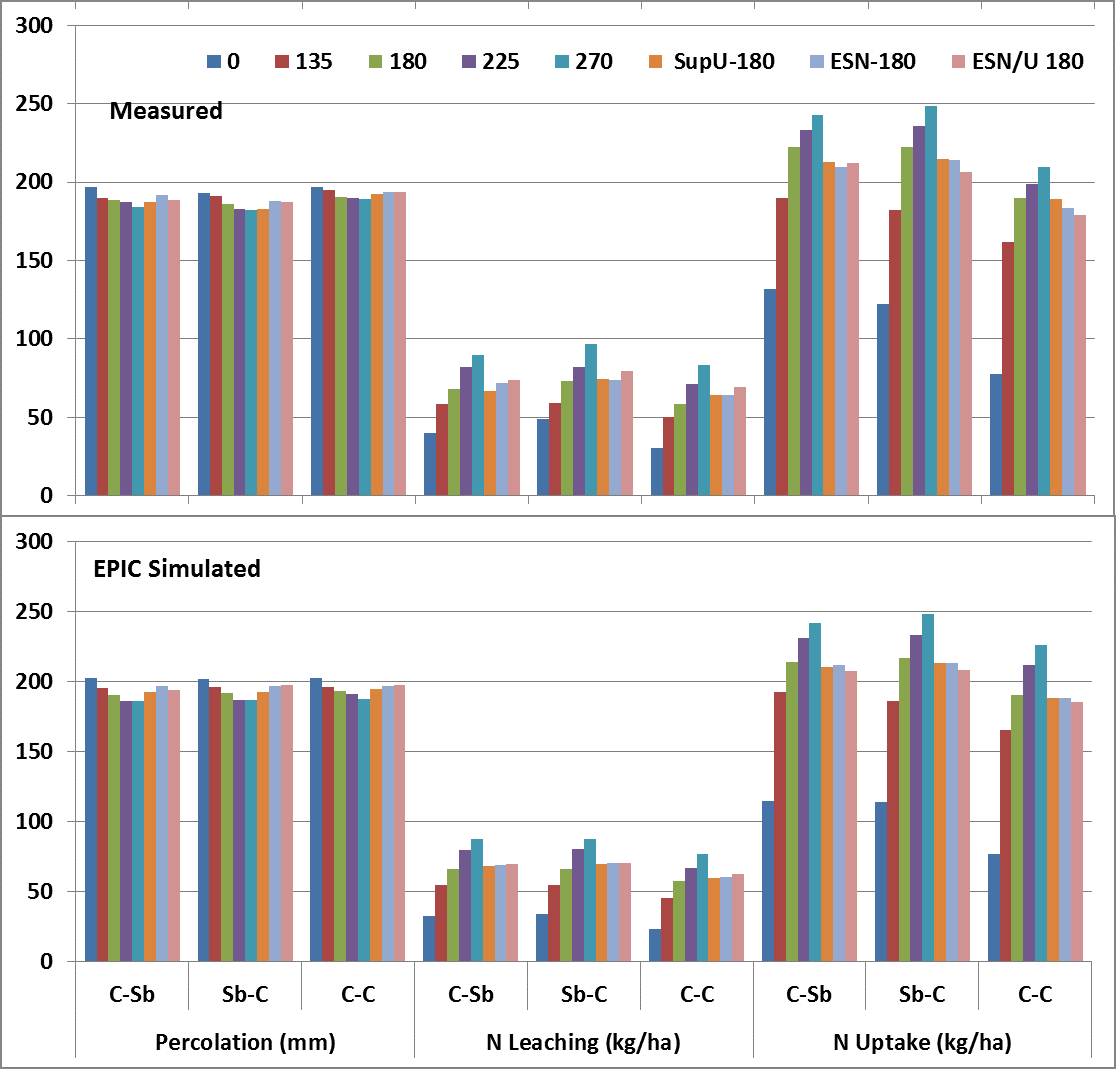
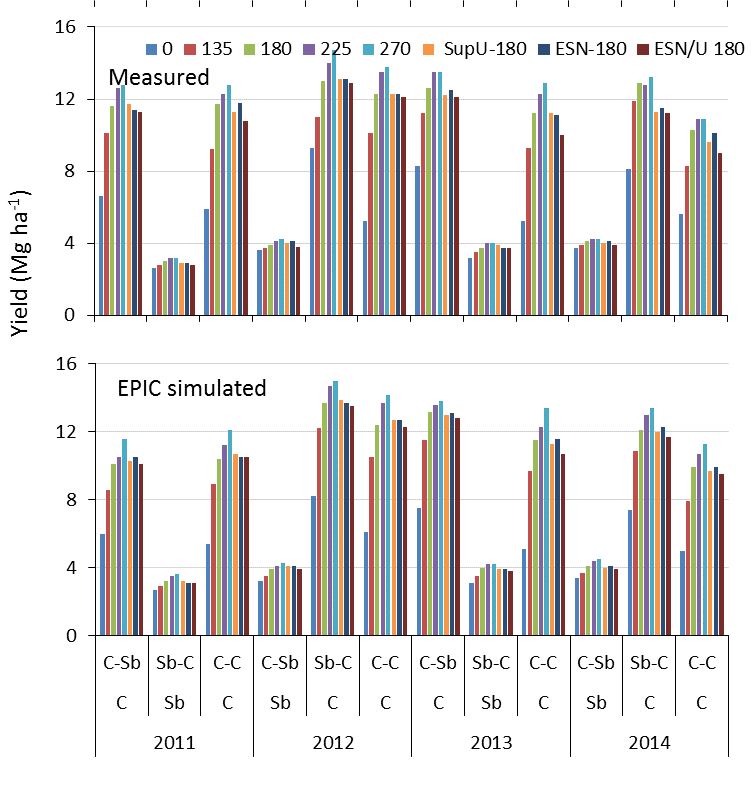
The objectives of our study were to test EPIC model suitability and accuracy to simulate yield, N uptake, and NO3- leaching in the central sands region of Minnesota, under C-C, C-Sb, and Sb-C rotation, and ultimately to model a range of alternative practices that can minimize leaching losses in the Central Sands Region of Minnesota.
Modeling Approach and Assumptions
EPIC model calibration process was made based on the identified sensitive input parameters pertaining to grain yield, nitrogen uptake, drainage and nitrogen leaching losses.
Calibration & Validation Use half of data for calibration (2011-12), half for validation (2013-14). Parameter were optimized on trial and error basis. Model calibration and validation procedures were conducted after sensitivity analysis. EPIC model parameter sensitivity analysis was made following the procedures of Hoffman et al., (1983), to calculate the sensitivity index (SI) associated with crop growth, nitrogen uptake and nitrogen leaching losses following the procedures of Hofman et al. (1983). This procedure considers the minimum and maximum output values resulting from varying the input over its entire range. The SI equation is:

Evaluation of the model efficiency was performed using Nash-Sutcliffe coefficient (NSE) and presented using graphical comparison of measured and simulated outputs.


