Gabriel Dias Paiao
5 April 2018
Advisor: Fabián Fernández
Canopy Sensing and Nitrogen Management
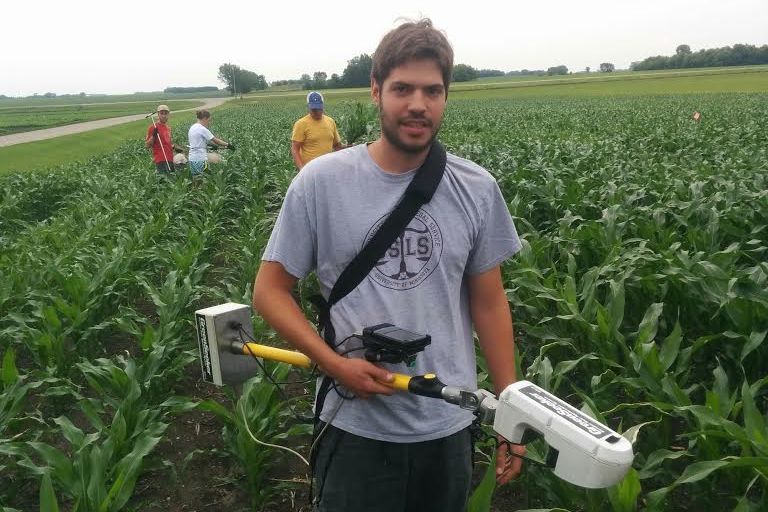
Ideally, corn growers should only apply the gap between the nitrogen (N) provided by the soil and the N required by the plant, but within-field spatial variability and the unpredictable role weather will have on the soil-crop N dynamics makes determining optimum N rates very difficult. Active canopy sensors have been proposed as a tool to improve corn N management, under the premise that plant greenness is a good integrator of factors like soil N supply, climatic conditions and crop management. Greenness measurements can be taken on a high-density spatial scale allowing for spatial variability characterization to dictate variable N rates on the go.
Corn Response to Nitrogen Application Timing
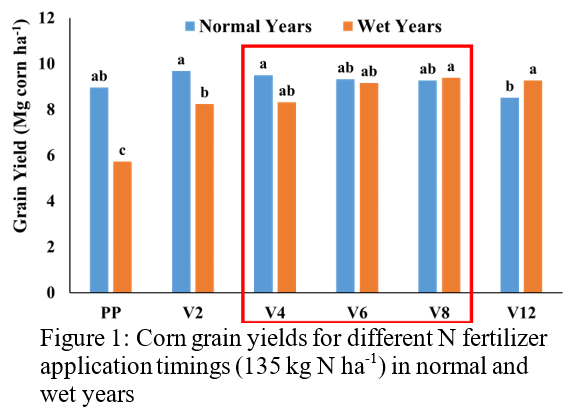
If canopy sensors are to be used as a tool to quantify in-season N requirements, it is crucial to understand how corn plants respond to different N application timings. When the N fertilizer is applied at pre-plant (PP) or split-applied at PP/V2 it may happen that excessive precipitation in wet years result in N losses through leaching and denitrification, reducing the yield potential (Figure 1). Conversely, late applications of nitrogen (PP/V12) may result in yield losses if there is not enough moisture to incorporate N fertilizer into the root zone (Figure 1). Because of that, canopy sensing and sidedressing between V4 and V8 appear to be the most appropriate timings, as grain yields tend to be the highest with N applications in those stages, regardless of weather conditions.
Grain Yield Predictions
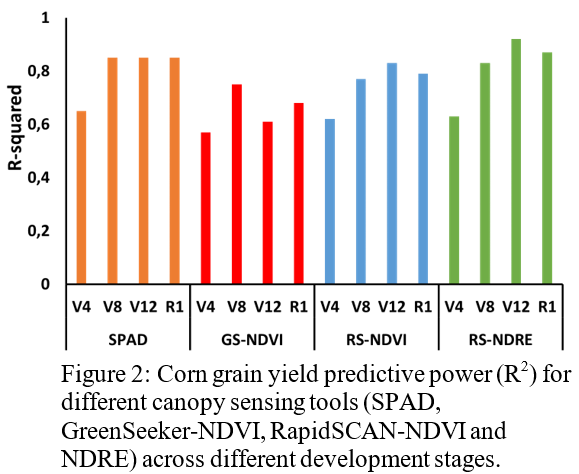
Various sensor-based N recommendation algorithms rely on estimations of grain yield potential to prescribe the N rate. Consequently, accurate predictions by the sensors are essential for successful implementation of the technology. Canopy sensing at V4 stage produced the lowest grain yield predictive power regardless of the sensor used, likely because plants had not developed N deficiency yet (Figure 2). The NDVI measurements had the lowest predictive power in the study, regardless of sensing tool (Figure 2). That lower performance was at least partially caused by index saturation, as the red band is known to saturate with high biomass coverage. Except for the GS-NDVI, sensors provided the highest grain yield predictive power at V12 (RS-NDRE was the most accurate in the study with R2 of 0.92). This was likely because by V12 plants had already integrated a substantial portion of the growing season conditions impacting grain yield. However, applying N that late in the season would require high clearance equipment, and there is the risk of yield losses if dry conditions delay N incorporation into the root zone. Based on that, grain yield predictions at V8 would be a viable alternative, as prediction models were still fitted at an acceptable level at this stage (Figure 2) and there would be more flexibility for fertilizer application while the crop is still short enough for traditional application equipment.
Nitrogen Deficiency Determination
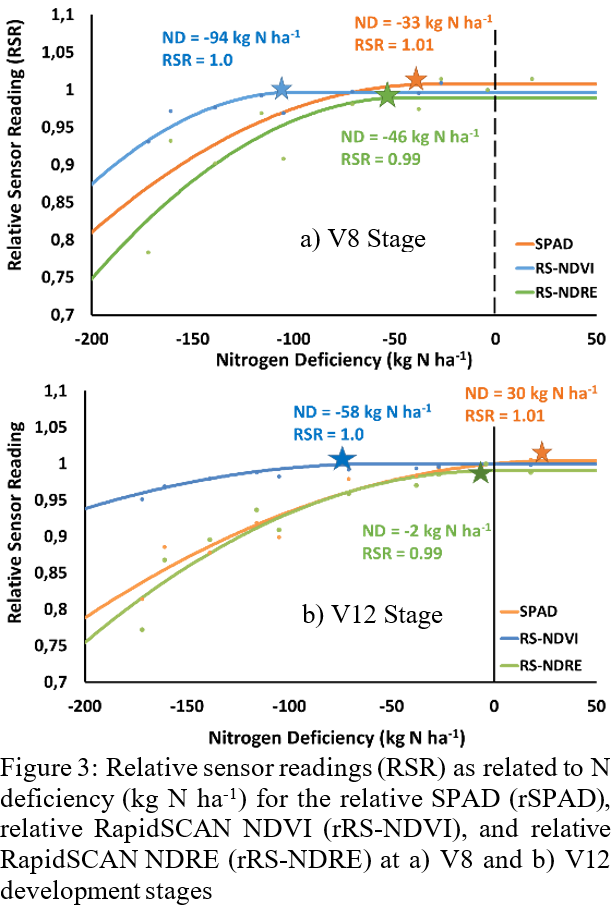
Ideally, the relationship between relative sensor readings (RSR) and N deficiency should reach a plateau at the optimum N rate (nitrogen deficiency = 0 kg N ha-1). This would indicate that plots under N deficiency have lower sensor readings (lower greenness) than plots under N sufficiency. None of the sensors presented a significant relationship at V4 stage, confirming as observed for grain yield predictions, the low utility of sensing plant greenness at this early stage. At V8, all the sensors had statistically significant relationships, but the plateau was reached at N deficiency levels lower than the optimum N rate (Figure 3), indicating underestimation of the N needs, likely because of a lack of N stress, as N supply might have been adequate at that stage. As the season progressed, and crop N-demand increased above the soil supply, N deficiency symptoms became more detectable. The most accurate estimation of N deficiency was obtained at V12 stage with the RS-NDRE (Figure 3), with a plateau only 2 kg N ha-1 lower than actual optimum rate. Even though these results seem promising, there was a lot of variability in these measurements, resulting in a large confidence interval for the plateau (±41 kg N ha-1). Additionally, as noted earlier, sensor-based applications of N at those late stages may not result in complete yield recovery (Figure 1).
Canopy Sensing and Soil Nitrogen Information
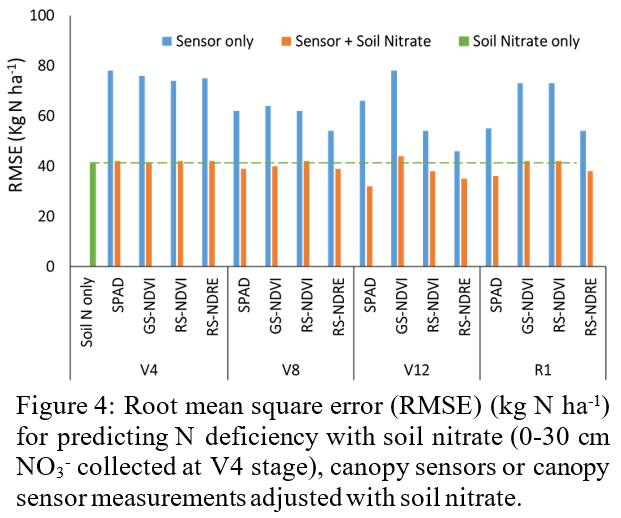
Some growers in the U.S. Midwest use the pre-sidedress nitrate test (PSNT) to guide in-season N applications on corn. We investigated the usefulness of those measurements (0-30 cm NO3- collected at V4 stage) to adjust sensor-based N recommendations. Canopy sensing at V4 stage benefitted the most from adjustments with soil nitrate, but prediction accuracy was similar to that obtained with soil N measurement alone (Figure 4). While soil sampling at fine spatial-scales like those employed in this study (every plot) may not be practical in commercial large-scale cropping systems, these results point out that canopy sensors alone cannot fully integrate soil N availability and that there is a potential utility for managing fertilizer N with soil N information. It is feasible to collect dense spatial resolution data with canopy sensors. If canopy sensors could be correctly adjusted with less densely-collected soil data, there could be important improvements made for in-season variable rate N applications. At later development stages, soil nitrate tended to become less useful to improve sensor-based N recommendations (Figure 4), as plant greenness become a better indicators of plant N status.
