Brian Bohman
22 March 2018
Advisors: Carl Rosen & David Mulla
Determining Crop Nitrogen Status
Determining the in-season crop nitrogen status [CNS] is critical to making the best possible decisions for supplemental N fertilizer applications. There are many ways to assess CNS ranging from qualitative observations of visible crop nitrogen deficiency symptoms, direct measurement of crop nitrogen content from biomass samples, and indirect measurements using remote or proximal sensing. While plant tissue samples are the most accurate method to determine CNS, they are also highly resource intensive and have poor temporal and spatial coverage compared to remote sensing.
Nitrogen Sufficiency Index Approach
Remote sensing is the most promising ways to determine CNS and in turn determine the rate and timing of supplemental N fertilizer applications; to be most effective, however, remote sensing measurements need to be translated from relative (i.e. vegetative index [VI] value) to absolute terms (i.e. mg N kg-1). One technique, known as the Nitrogen Sufficiency Index, normalizes VI by using a “well fertilized reference”. Plot scale research we have conducted using the NSI approach to make in-season N fertilizer decisions for potato in Central Minnesota has found that N rate can be reduced by 8 – 17 % without a significant difference in yield. However, effectiveness of NSI depends strongly on the “well fertilized reference” which may not work for production systems.
Nitrogen Nutrition Index Approach
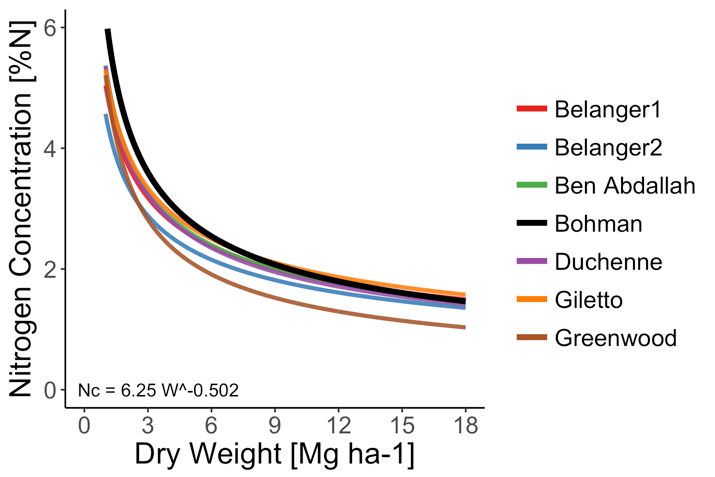
Another approach to calculate in-season CNS is the Nitrogen Nutrition Index [NNI]. The NNI uses the Critical Nitrogen Dilution Curve [CNDC] to determine whether a crop has sufficient nitrogen content – a plant is N deficient when the observed N concentration is less than the critical N concentration for a given amount of biomass. For potato, at least 6 CNDCs have been developed across the world but have not yet been developed for the Upper Midwest. Using 3 site-years of data from a plot-scale study in Central Minnesota with 4 – 5 in-season sampling dates and multiple varieties and nitrogen rates, we have developed a CNDC appropriate for potato grown in this region (Fig. 1). The CNDC we derived is not significantly different from the others curves that have been previously identified. Using a relative yield response, we also found that the critical NNI value for potato in Minnesota is 1.20, comparable to other previous studies.
While NNI is useful because it does not require a “well fertilized reference”, it does require in-season biomass sampling which makes this method less suitable for field scale applications. It may be possible, however, to develop algorithms to transform remote sensing measurements into NNI values. Achieving this would give some degree of absolute meaning to remote sensing measurements and improve our ability to diagnose CNS.
Remote Sensing of NNI in Potato
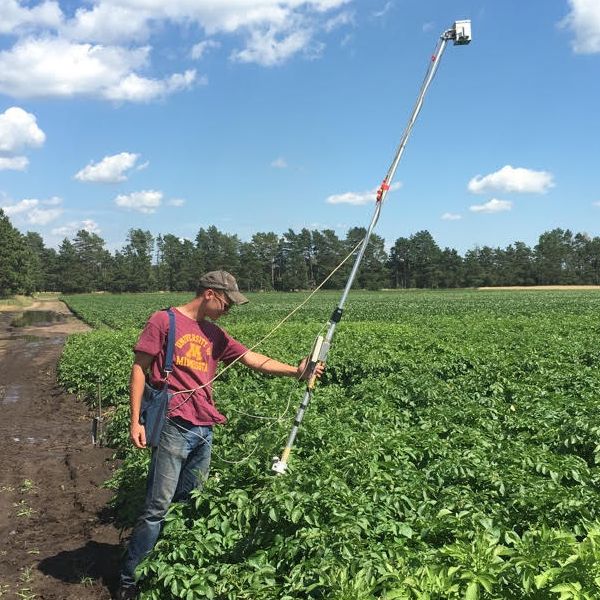
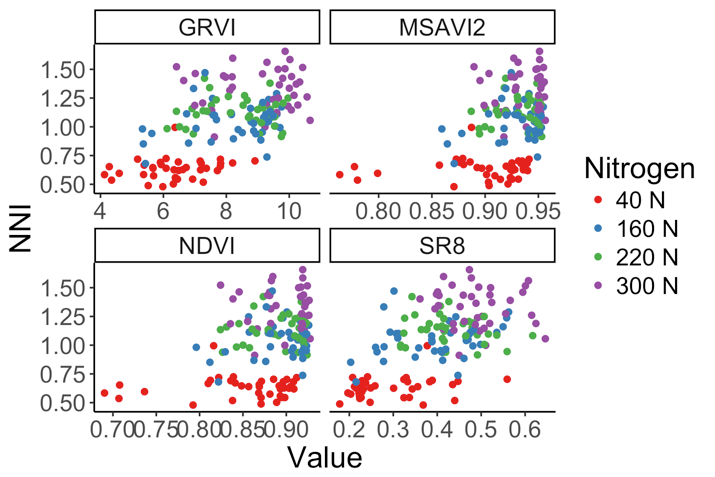
In one site-year (2016) of the study previously referenced, remote sensing observations were collected within 1-2 days of plant biomass samples using a CROPSCAN MSR-16R. This passive, multispectral radiometer has 16 narrow bands spread across the visible, red-edge, and near infrared portions of the spectrum. Four VIs that were previously identified as correlating with CNS in potato (NDVI, MSAVI2, SR8, and GRVI) were compared to measured NNI values. NNI was calculated by comparing the nitrogen concentration in the whole plant samples collected with the CNDC developed in this study.
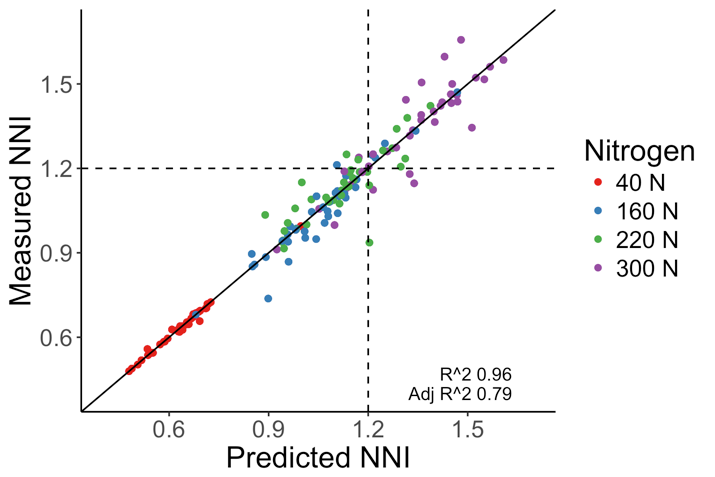
Alone, these VIs are not accurate predictors of NNI; however, a linear combination of these four VIs is a much more accurate and appropriate predictor of NNI. The combination of indices that saturate out with full canopy cover (i.e. MSAVI2 and NDVI) with indices that are less sensitive to biomass (i.e. SR8 and GRVI) was found to be important. Combined, these VIs can explain 79% of the observed variability in the measured NNI data. And importantly, all 4 VIs used in this algorithm could be computed using broadband RGB-NIR imagery that is already widely available from UAV and satellite imagery.


